Tuesday, December 10, 2013

Win32 SEH Exceptions

Below is the diagram of how the debugger gets the events when an exception happens.
  • The Debuggee sends a notification to the Debugger when the exception happens for the first time.
    This is event is sent to the debugger even before the debuggee gets a chance to handle it.
  • If the debugger ignores this and continues
  • 2nd Chance Exception is sent to the debugger to some handling
Here is the output of the debugger.
"First chance exceptions are reported before any exception handling."
(211c.2840): C++ EH exception - code e06d7363 (first chance)
(211c.2840): C++ EH exception - code e06d7363 (!!! second chance !!!)

Tuesday, October 22, 2013

ASM code generation using the cool -FA compiler switch

Recently I was try to experiment with some calling conventions and I wanted to look at the assembly code, to better understand the behavior.
There are couple of ways.
1. Look the dis-assembly while debugging.
2. use the very cool ollydbg!
3. Generate one for yourself while building the binary!!
That is where the magical compiler -FAs switch comes in the play. Following was the code I test it with
***********************************************************************
my 'C' code
void foo() { printf("in foo"); } // This code is compiled using compiler flag -FAs switch to generate and equivalent ASM code int _tmain(int argc, _TCHAR* argv[]) { foo(); return 0; } ************************************************************************ ************************************************************************ Generated Assembly code(I have only shown the main portion of the code) PUBLIC _wmain ; Function compile flags: /Odtp /RTCsu /ZI ; COMDAT _wmain _TEXT SEGMENT _argc$ = 8 ; size = 4 _argv$ = 12 ; size = 4 _wmain PROC ; COMDAT ; 16 : { push ebp mov ebp, esp sub esp, 192 ; 000000c0H push ebx push esi push edi lea edi, DWORD PTR [ebp-192] mov ecx, 48 ; 00000030H mov eax, -858993460 ; ccccccccH rep stosd ; 17 : foo(); call ?foo@@YAXXZ ; foo //call to foo ; 18 : return 0; xor eax, eax ; 19 : } pop edi pop esi pop ebx add esp, 192 ; 000000c0H cmp ebp, esp call __RTC_CheckEsp mov esp, ebp pop ebp ret 0 *******************************************************************************************
Nevertheless a nice way to look at the Assembly code!

Saturday, June 22, 2013

Hadoop installation on my linux box

Today was fun! installed Single node hadoop system and run some samples
on text search, it was just a breeze need to do more investigation on how it works.


The following blogs where helpful.
http://www.michael-noll.com/tutorials/running-hadoop-on-ubuntu-linux-single-node-cluster/
http://mohsin-junaid.blogspot.in/2013/02/how-to-install-hadoop-104-on-ubuntu.html


Saturday, December 22, 2012

Remembering Ramanujan!

Today is Ramanujan's  Birthday happened to go over this wiki,
 http://en.wikipedia.org/wiki/Srinivasa_Ramanujan
and this documentary
http://www.youtube.com/watch?v=OARGZ1xXCxs

What struck me is his Humility and Single mindedness among many other virtues.

Thursday, February 2, 2012

Debugging using .MAP and .COD file: The forgotten Method.

I was trying to use MAP to debug suddenly found something is missing after some searching here is what I found.
Couple of years back VC++ developers where using this method to debug  applications.
This was using
/MAP,
/MAPINFO: EXPORTS linker switches and
/MAPINFO: LINES compiler switch

Unfortunately /MAPINFO: LINES has been deprecated starting VS 2003.

So here is how to achieve the same result with VS 2005 and above.
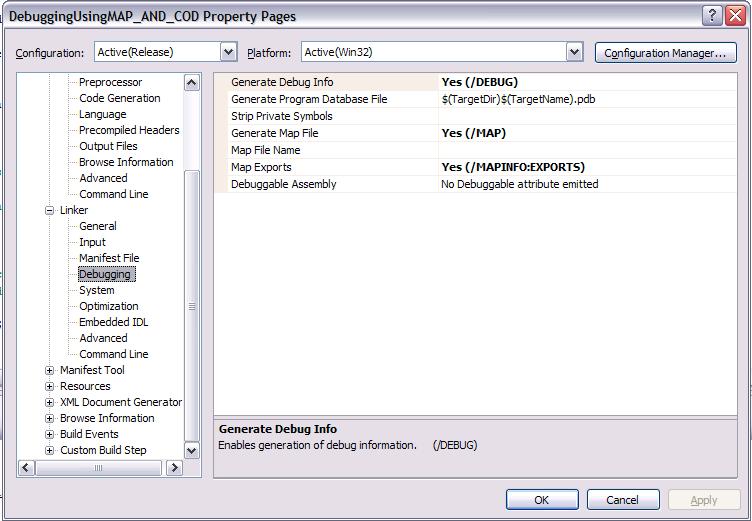
First the required settings :

  1. We need to do the following settings in the linker section need to select the
    1. Generate MAP file
    2. MAP file exports
             As shown in the fig below.

  1. Do the following settings in the C++ section of the project.
    1. Assembler output: add the compiler switch /FAcs
This will output a .cod file which will contain both the machine code , assembly code along with Source. As shown in the figure below.

Next the actual debugging.

  1. The following will be the code snippet I plan to use to simulate the exception.
            char* chCrash=NULL;
   *chCrash='x';

  1. Once you run the faulty program you will end up with access violation dialog as shown below.


  1. You can address in this exception is 0x00040106c.
  2. Open the MAP file you will find the preferred load address.
        Preferred load address is 0x00400000

  1. Exception address – Load address = offset where the exception has happened. Which would be : 0x106c.
  2. But the actual WinMain starts at 0x1000 from 0x00400000
  3. So the actual offset would be 0x6c
  4. This offset lies between the
0001:00000000       _wWinMain@16               00401000 f   DebuggingUsingMAP_AND_COD.obj

0001:00000100       ?MyRegisterClass@@YAGPAUHINSTANCE__@@@Z 00401100 f   DebuggingUsingMAP_AND_COD.obj

As shown in the above two lines from the .MAP file.

  1. So now open the .COD file and go to an offset 0x6c from _wWinMain@16        
     0006c  c6 00 78          mov    BYTE PTR [eax], 120           ; 00000078H
           Here 120 is the ascii value of ‘x’, which corresponds to *chCrash='x';

That is it! For now hopefully I have revived some old memories.